The Best Indicators to Use with RSI
RSI trading strategy, rsi in stock market
Share this Post to earn Money ( Upto ₹100 per 1000 Views )
When it comes to technical analysis in the financial markets, the Relative Strength Index (RSI) is a widely used momentum oscillator that measures the speed and change of price movements. While RSI is a powerful tool on its own, combining it with other indicators can lead to more accurate trading signals and enhance overall trading strategies. In this article, we'll explore the top indicators to use with RSI, including RSI divergence, RSI with MACD, RSI with Bollinger Bands, and RSI with EMA, to help you uncover profitable trading opportunities.
RSI Divergence:
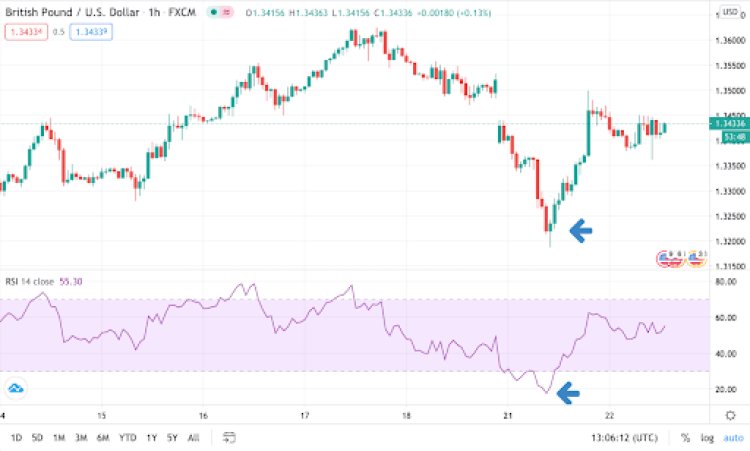
RSI divergence is a crucial concept that can signal potential trend reversals. It occurs when the Relative Strength Index indicator's movement disagrees with the price movement on the chart. There are two types of RSI divergence - bullish and bearish. Bullish RSI divergence forms when the price makes lower lows while the RSI creates higher lows, indicating a possible trend reversal to the upside. Conversely, bearish RSI divergence occurs when the price makes higher highs, but the RSI forms lower highs, suggesting a potential downtrend reversal. By identifying RSI divergences, traders can anticipate trend shifts and make well-timed entry or exit decisions.
RSI with MACD:
Combining RSI with the Moving Average Convergence Divergence (MACD) can provide a powerful synergy for traders. While RSI focuses on momentum and overbought/oversold conditions, the MACD offers insights into trend direction and strength. When the RSI and MACD generate signals in the same direction, it reinforces the validity of the trade. For instance, when the RSI indicates an overbought condition, and the MACD confirms a bearish crossover, it may serve as a strong sell signal. Conversely, a bullish RSI signal accompanied by a bullish MACD crossover could indicate a potential buy opportunity.


