Chart Patterns Stocks
Chart patterns are an essential tool in stock market analysis. They are visual representations of price movements that can be used to identify different trade opportunities
Share this Post to earn Money ( Upto ₹100 per 1000 Views )
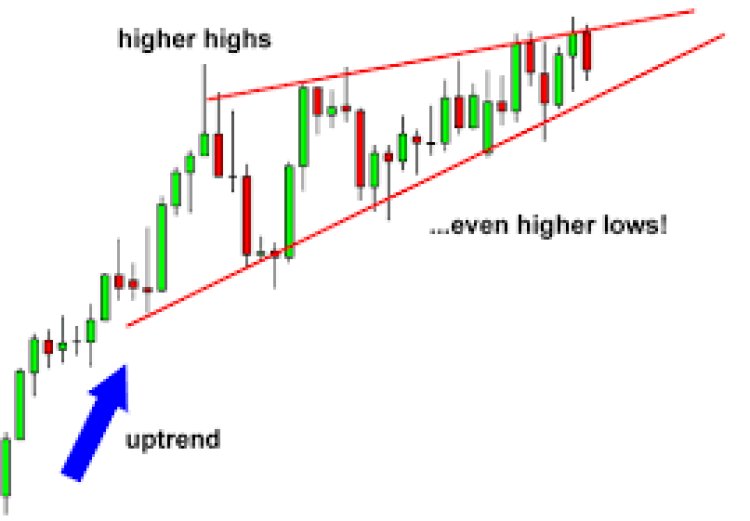
Chart patterns are an essential tool in stock market analysis. They are visual representations of price movements that can be used to identify different trade opportunities. A chart pattern is simply a graphical representation of a stock's price movements over a period of time. Chart patterns can illustrate both bullish or bearish trends, and help traders and investors find potential entry and exit points in the market.
Examples of chart patterns include the Head and Shoulders pattern, the Cup and Handle, the Double Top, and the Flag pattern. Each of these chart patterns requires detailed analysis before making any trading decisions.
- Head and Shoulders: The Head and Shoulders pattern is a classic chart pattern that shows an uptrend followed by a peak, then a retracement followed by a higher peak and another retracement. This is a good indication of a potential trend reversal.
- Cup and Handle: The cup and handle chart pattern is considered a continuation pattern rather than a reversal one. This pattern looks like a cup with a handle attached to its right side. When prices move beyond the handle, it is an indication of an upward trend.
- Double Top: The double top pattern is a reversal pattern that appears at market tops. It is essentially two consecutive high points that form an "M" shape. The pattern usually signals a bearish trend and traders could look to take profits out of their positions.


