Grafana Open Source: Best Practices for Optimizing Performance
Unlock the full potential of Grafana Open Source. Discover essential best practices to boost performance and streamline your monitoring solutions.
Share this Post to earn Money ( Upto ₹100 per 1000 Views )

Grafana Open Source has become an indispensable tool for many organizations looking to visualize and monitor their data effectively. However, to fully leverage its capabilities, it’s crucial to implement best practices that optimize performance. This article delves into the key strategies to ensure your Grafana Open Source deployment runs smoothly and efficiently.
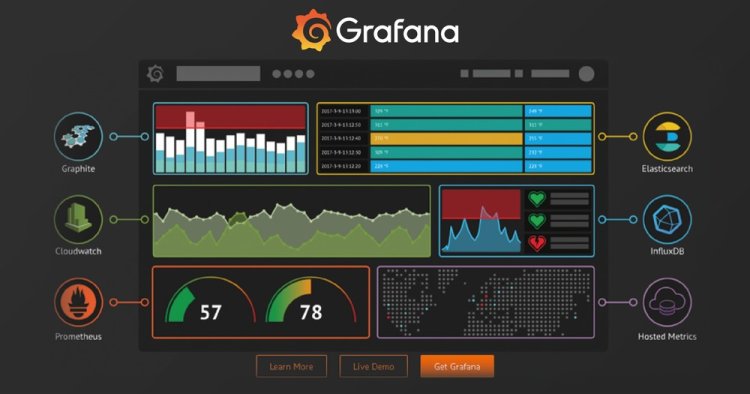
Grafana Open Source is a powerful and flexible platform used for querying, visualizing, and alerting on metrics and logs. It integrates with a wide array of data sources, enabling users to create informative dashboards that provide insights into the performance of their systems and applications.
Best Practices for Optimizing Grafana Open Source Performance
1. Efficient Data Source Configuration
One of the first steps in optimizing Grafana Open Source is to ensure that your data sources are configured efficiently. Use appropriate data source plugins that suit your needs and make sure to fine-tune the settings for optimal performance. For instance, when using time-series databases like Prometheus or InfluxDB, ensure they are properly indexed and optimized for fast query performance.
2. Dashboard Optimization
Dashboards are at the heart of Grafana’s functionality. However, poorly designed dashboards can lead to performance issues. To avoid this:
-
Limit the Number of Panels: Each panel on a dashboard generates a separate query to the data source. Limiting the number of panels can reduce the load on your system.
-
Use Templating and Variables: Templating and variables can make your dashboards more dynamic and reduce the number of static queries.
-
Optimize Panel Queries: Ensure that queries are optimized and only fetch necessary data. Avoid using wildcards or overly broad queries that can strain the data source.
3. Efficient Use of Annotations
Annotations provide a way to mark specific events on your graphs, but excessive use can lead to performance degradation. Use annotations sparingly and ensure they are relevant to the data being displayed.
4. Alerting Best Practices
Grafana Open Source offers robust alerting capabilities, but it’s essential to configure alerts efficiently:
-
Set Appropriate Alert Intervals: Avoid setting alert intervals too short, as this can lead to excessive querying and performance issues. Balance between timely alerts and system load.
-
Group Alerts: Grouping similar alerts can reduce the number of queries and improve performance.
5. Scaling Grafana
As your data and user base grow, you may need to scale Grafana to maintain performance:
-
Horizontal Scaling: Deploy multiple Grafana instances behind a load balancer to distribute the load.
-
Vertical Scaling: Increase the resources (CPU, memory) allocated to your Grafana instance to handle more significant loads.
6. Regular Maintenance and Monitoring
Regular maintenance is critical to ensuring optimal performance:
-
Upgrade Grafana Regularly: Keep Grafana up-to-date with the latest releases to benefit from performance improvements and new features.
-
Monitor Performance: Use Grafana’s own monitoring capabilities to track performance metrics and identify bottlenecks.
7. Caching and Data Retention
Implement caching mechanisms to reduce the load on your data sources. Also, consider data retention policies to manage the volume of data stored and queried, which can significantly impact performance.
Conclusion
Grafana Open Source is a versatile and powerful tool for data visualization and monitoring. By following these best practices, you can optimize its performance, ensuring that your dashboards are responsive and your alerts are timely. Efficient data source configuration, dashboard optimization, efficient use of annotations, alerting best practices, scaling strategies, regular maintenance, and caching are all crucial steps to take. With these strategies in place, Grafana Open Source can help you gain valuable insights and maintain robust system performance.


