US India Trade Data: India Overtakes Italy to Become 10th
As per US India Trade statistics & US imports from india Data, India has replaced Italy to take the 10th spot in the US trade deficit rankings in 2024. Discover the key factors driving this shift.
Share this Post to earn Money ( Upto ₹100 per 1000 Views )

India Overtakes Italy in US Trade Deficit Rankings in 2024
In 2024, India has risen to the 10th spot in the U.S. trade deficit rankings, surpassing Italy. This shift is largely due to a significant increase in India's exports to the United States, especially in electronics. The U.S. trade deficit with India has grown to around $38 billion, reflecting the rise in imports from India, which is now a key player in the global technology supply chain.
Key Factors Behind India's Rise in US Trade Deficit Rankings:
- Electronics Exports Surge: One of the main contributors to this growth is the significant rise in India's electronics exports to the U.S. As India becomes more integrated into the global technology supply chain, its role as a key trading partner for the U.S. continues to grow.
- Trade Deficit Expansion: The U.S. trade deficit with India has expanded notably, reaching $38 billion in 2024. This shift signifies India’s increasing presence in the U.S. import market.
This change is significant as the U.S. has been concerned about growing trade deficits, especially with countries like China and India. Under previous administrations, there were discussions about addressing these imbalances through tariffs or other measures. While it remains uncertain how these concerns will be addressed, it is clear that India's trade activities are reshaping the U.S. trade deficit landscape.
Top 10 US Imports from India (2023-2024)
According to US trade data, here are the top 10 imports from India that are contributing to the growing trade deficit:
As per US import Data & US India Trade data & Statistics
- Precious Stones and Metals (HS Code 71) - $12.36 billion
- Electrical Machinery and Equipment (HS Code 85) - $12.07 billion
- Pharmaceutical Products (HS Code 30) - $10.97 billion
- Nuclear Reactors and Machinery (HS Code 84) - $6.67 billion
- Mineral Fuels and Oils (HS Code 27) - $5.13 billion
- Organic Chemicals (HS Code 29) - $3.86 billion
- Other Made-Up Textile Articles (HS Code 63) - $2.92 billion
- Articles of Iron or Steel (HS Code 73) - $2.88 billion
- Vehicles (HS Code 87) - $2.70 billion
- Articles of Apparel or Clothing (HS Code 61) - $2.53 billion
India-US Trade Statistics
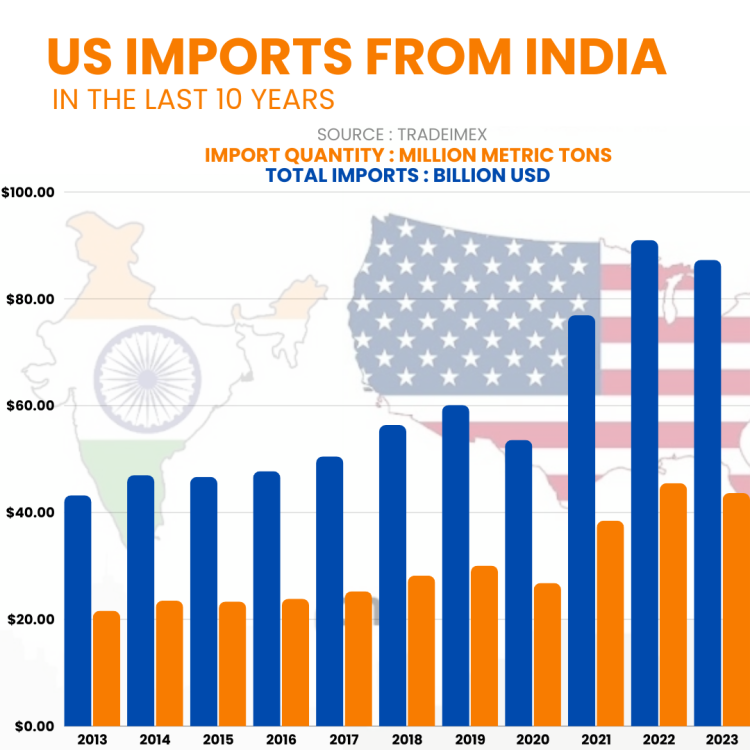
The increase in U.S. imports from India highlights the strong trade relationship between the two countries. In 2023, India’s exports to the U.S. reached $87.28 billion, and in 2024, the figure crossed $77 billion. India has become one of the top 10 countries in the U.S. trade deficit rankings, marking its growing importance as a trading partner.
Conclusion
India’s rise in the U.S. trade deficit rankings reflects its growing significance in the global trade landscape, particularly in technology and electronics. As both countries continue to expand their trade ties, it’s clear that India will remain a key player in U.S. imports. For more detailed trade statistics and insights, you can explore U.S. Census Bureau data on trade balances and trends.
Also read about :-


