Get Started with Grafana Open Source for Free Monitoring
Unlock powerful monitoring with Grafana Open Source! Start for free and visualize your data like never before. Easy setup and endless possibilities await!
Share this Post to earn Money ( Upto ₹100 per 1000 Views )
In today’s data-driven world, monitoring your systems, applications, and infrastructure is vital for ensuring optimal performance and reliability. Grafana Open Source has emerged as a powerful tool for visualizing and analyzing data from various sources, making it an essential resource for developers, system administrators, and business analysts alike. This article will guide you through the essentials of getting started with Grafana Open Source for free monitoring, enabling you to harness the power of data visualization.
What is Grafana Open Source?
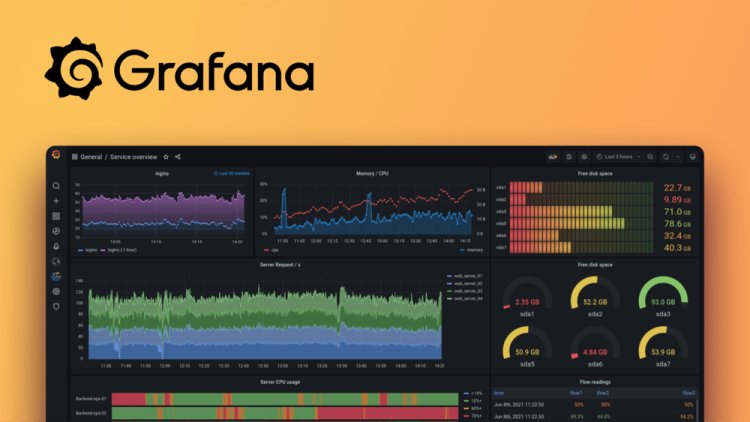
Grafana Open Source is a free, open source analytics and monitoring platform that allows users to visualize and analyze metrics from diverse data sources. With its intuitive interface, customizable dashboards, and powerful alerting capabilities, Grafana enables users to gain insights into their data quickly and effectively. Whether you're monitoring application performance, server health, or infrastructure metrics, Grafana provides a versatile solution tailored to your needs.
Step 1: Installation
Getting started with Grafana Open Source begins with installation. Grafana can be easily installed on various operating systems, including Windows, macOS, and Linux. Follow these steps to install Grafana:
1. Download Grafana: Visit the Grafana website and download the appropriate package for your operating system.
2. Install Grafana: Follow the installation instructions specific to your OS. For Linux users, you can use package managers like apt or yum, while Windows users can run the installer.
3. Start Grafana: Once installed, start the Grafana server. Typically, you can access Grafana by navigating to http://localhost:3000 in your web browser. The default login credentials are usually admin for both the username and password.
Step 2: Adding Data Sources
After logging into Grafana, the next step is to connect your data sources. Grafana supports a wide range of data sources, including Prometheus, InfluxDB, MySQL, PostgreSQL, and more. Here's how to add a data source:
1. Navigate to Data Sources: Click on the gear icon (⚙️) in the sidebar and select "Data Sources."
2. Add a New Data Source: Click the “Add data source” button and select your desired data source from the list.
3. Configure the Data Source: Enter the required connection details, such as the database URL, authentication credentials, and any necessary configurations. After entering the details, click “Save & Test” to verify the connection.
Step 3: Creating Dashboards
With data sources connected, you can now create dashboards to visualize your data effectively:
1. Create a New Dashboard: Click on the “+” icon in the sidebar and select “Dashboard.”
2. Add Panels: Click “Add new panel” to choose a visualization type (e.g., graph, table, gauge). Select the data source you want to visualize and configure the query to fetch the relevant data.
3. Customize Your Panel: Grafana offers various customization options, including colors, legends, and axes. Adjust these settings to create a visually appealing and informative dashboard.
4. Save the Dashboard: Once satisfied with your dashboard, click the save icon and give your dashboard a meaningful name.
Step 4: Setting Up Alerts
Monitoring is not just about visualization; it also involves alerting. Grafana allows you to set up alerts based on specific conditions, ensuring you’re notified of any critical issues:
1. Open the Panel Settings: Click on the panel where you want to set up alerts, then click on the “Alert” tab.
2. Define Alert Conditions: Specify the conditions under which you want to be alerted, such as thresholds for specific metrics.
3. Set Notification Channels: Configure how you’d like to receive alerts (e.g., email, Slack, PagerDuty) by selecting or creating notification channels in the Grafana settings.
4. Save the Alert: After configuring the alert conditions and notification settings, save the changes to activate the alerts.
Step 5: Exploring Plugins and Community Resources
Grafana Open Source has a rich ecosystem of plugins that extend its functionality. Explore the Grafana Plugin Catalog to find and install additional visualization options, data source connectors, and applications that can enhance your monitoring experience.
Additionally, the Grafana community is vibrant and active, providing resources such as forums, documentation, and tutorials. Engage with the community to learn best practices, share insights, and troubleshoot any issues you may encounter.
Conclusion
Getting started with Grafana Open Source for free monitoring is a straightforward process that unlocks powerful data visualization capabilities. By following the steps outlined in this guide—installation, data source configuration, dashboard creation, alert setup, and exploration of plugins—you can create a comprehensive monitoring solution tailored to your needs. Embrace the power of Grafana Open Source to turn your data into actionable insights, ensuring your systems and applications run smoothly and efficiently. Start your Grafana journey today and transform the way you monitor and analyze data!


